A well-organized, managed and strategically planned library network of organizational units is the foundation for the success of any public library in its local environment. Its basic building entity is the branch library. When the library plans change in its network, it starts from the assumption that the new network as a whole will work better than the existing network. The library must have a clear picture of interventions and changes in the network that influence the choice of an alternative location for the library branches, of expanding to new neighbourhoods, and of the closure of the library at a certain location.
Designing a sustainable and well-coordinated library network requires careful consideration and a structured approach to the preparation and analysis of the state of the current network. It is necessary to obtain and compare all available data, which may be a more or less important factor in decisions regarding the locations of the library network.
The network plan must be based on a spatial examination that includes a description of the area and its analysis. The description of the field is obtained through environmental research (geographic, demographic, economic, social-cultural, technological and natural environment). Segmentation based on demographics must cover the entire population of the area in question by comparing the proportion of active members within the population, while segmentation based on the use of library services must cover actual users of the library (membership, visits, loans).
For effective analysis of the area, the library has for some time had access to various geographical information systems (GIS). These types of tools enable those preparing analyses to present data in a visual form on cartographic bases.
Spatial analysis of the network of Slovenian public libraries
When planning the library network, Slovenian public libraries consider regional legislation and professional recommendations and standards. For network planning in cities, they recommend that at least 80% of the population of larger cities (i.e. those with at least 30,000 inhabitants) should be no more than 1,500 meters away from the nearest library. Adequate library services and resources must be provided by the central library for the needs of the wider gravity area of the city. The branch library must be located in the centre of the settlement, with adequate connections to the transport infrastructure, and it must be visible in the environment.
The issue of the network of locations where Slovenian public libraries carry out their activities has been dealt with at the national level by the Spatial Analysis of the Public Library Network in Slovenia project, started in 2011 by the National and University Library in cooperation with the Urban Planning Institute of the Republic of Slovenia (Vodeb, 2013; Vodeb & Vodeb, 2015). The main purpose of the project was to prepare an analysis of the accessibility of library services based on data about the distance of the population from the nearest location of library activity. The intention was that this data should help in planning the network of public libraries in Slovenia.
A methodology for checking accessibility to libraries was prepared, spatial data from the Statistical Office of the Republic of Slovenia was analysed, and accessibility calculations were carried out based on data concerning the locations of individual library locations, movable library collection locations, and mobile library stops. The analysis, which was also prepared at the level of the ten Central Regional Libraries network, showed that accessibility to library services in Slovenia is generally good.
It is recommended that the study should be enhanced by analysing the distance from the library to users of the library service with loan transactions, in order to get information about actual needs and services. On this basis, a study of the spatial simulation of the network of public libraries was prepared in cooperation between the national library and the Urban Planning Institute of the Republic of Slovenia (Študija …, 2015; Zakrajšek & Vodeb, 2020). An analysis of the state of the existing network of public libraries was prepared and a projection of the optimal network was proposed according to valid legal and professional starting points, and at the same time analysis and evaluation of the existing spatial criteria were prepared and suggestions of spatial elements for new criteria were made. Regardless of the final findings of the study, the most important result of the entire project was the preparation of a GIS tool/web application for spatial analysis of the library network. The tool is currently not publicly available due to technical upgrades, but we hope that it will be available for public use soon.
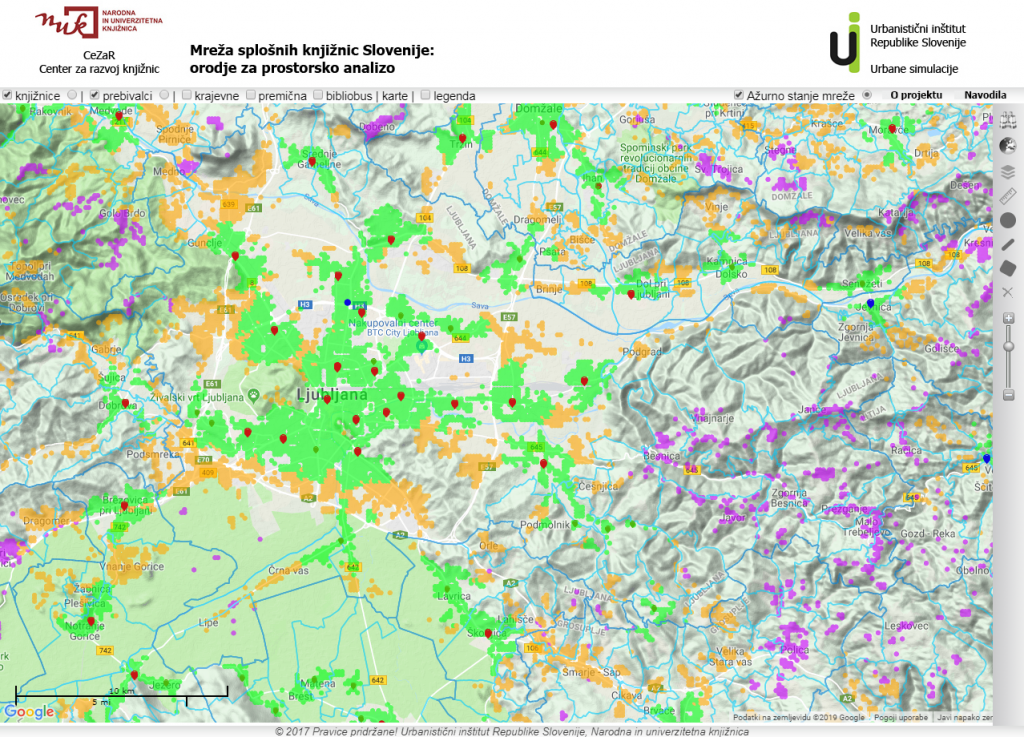
The tool for spatial analysis, like all visualizations based on the display of spatial data with GIS technology, enables a detailed analysis of the locations of the library networks of public libraries, including branch libraries and movable library collection locations, as well as the stops of mobile libraries. It is supplemented with basic demographic data on the population according to a spatial grid of 100 meters by 100 meters. The main significance of the tool is the possibility to represent visually the distance between the inhabitants and the nearest public library site, considering the geographical features of the terrain and, consequently, the real distance of the inhabitants to the given library location. It also enables finding the distance to the nearest location of the library network or a larger unit of the public library. With the help of a polygon, the selected radius of a circle or the radius of a route line, it is possible to determine the number of potential users in the analysed area and to obtain statistical and other basic data about the nearest branch library. Also included is a data layer with a simulation of a network of potentially missing libraries, derived from the findings of a spatial simulation study of a network of public libraries.
Unfortunately, the latest available version of the tool does not allow for analysis of the accessibility impact of the location of library buildings, which is a key issue in an urban environment. The research by Allen (2019) shows that in urban environments it is absolutely necessary to consider the form of personal transport, since access to libraries for car users is significantly worse than for individuals using other means of transport, and it is also necessary to consider the hour in the day and days of the week. For a society where the majority of daily journeys are made with a personal vehicle, and the number of households owning several cars is increasing, and on the other hand, public transport is consequently less efficient, it is very important that when planning the accessibility of public services, and as well as library activities, we need to take into account the established transport routes and modes of mobility of individuals, as well as the transport strategies of the local and wider environment.
An example of library network planning – the Ljubljana City Library
The Ljubljana City Library is the largest public library in Slovenia, with 35 branches and 47 mobile library stops, and the most networked cultural institution in Ljubljana. As such, it is ideal for preparing a pilot study of a library network in an urban environment. But, on the other hand, considering the evaluation needs of the Ljubljana City Library network urban areas, the Spatial Analysis of the Public Library Network in Slovenia Web Tool is less useful, as there are statistical data prepared only at the level of the entire municipality, but not at the level of the city District Authorities.
When planning the starting points for assessing the adequacy of the state of the Ljubljana City Library network, they have to consider additional sources of data from publicly available data portals, GIS tools, data collections and dedicated spatial applications, such as:
- The SiStat database from the Republic of Slovenia Statistical Office provides access to more detailed statistical data from various sources and is the main source for analysing the situation in Slovenia in various thematic areas.
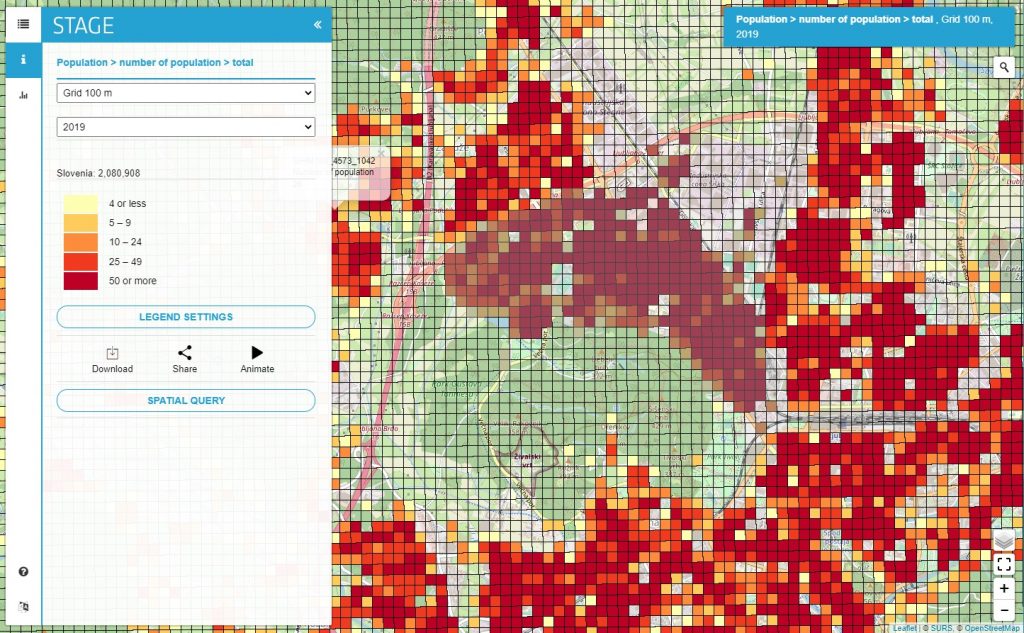
- An interactive cartographic application STAGE, also from the Republic of Slovenia Statistical Office, for displaying statistical data about Slovenia. It provides an interactive web map viewer as well as providing powerful analytical tools for spatial queries.
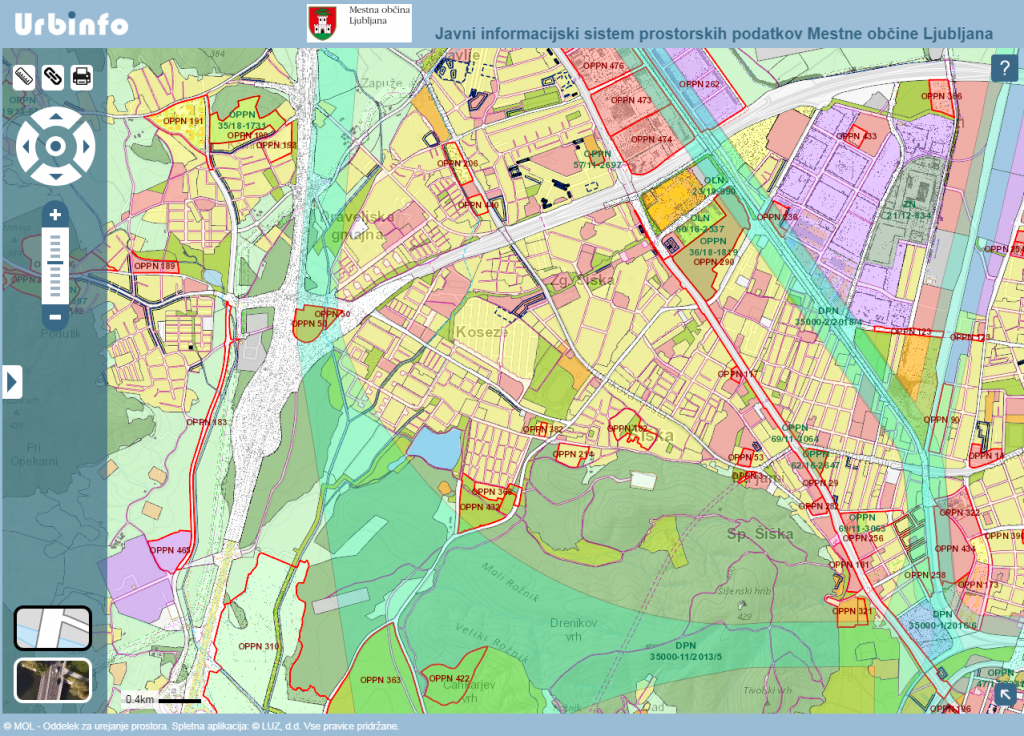
- The public spatial information system of the City of Ljubljana, URBinfo Portal, is intended for the visualization of all elements of the Municipal Spatial Plan, bringing also the full texts of the accepted content from The Strategic and Implementation Part, legal bases of valid and planned spatial acts and public records and data related to them.
Visualization with Google Maps
The use of dedicated licensed software tools for visualizing spatial data can be expensive [1] and requires special skills, as well as the corresponding more demanding hardware. For the need for regular monitoring of the state of the library network and the environment in which the library and its units operate, Ljubljana City Library decided to use the functionality of the Google Maps web mapping platform and created its own tool to support the planning of libraries using elements of GIS, based on the theoretical starting points of Lim & Park (2015).
Google Maps, as an online mapping service, allows the free use of maps, satellite, and aerial images of the earth, as well as a three-dimensional view, street images, traffic data in real-time, and route planning with different means of transport. The location information included in Google Maps makes it possible to connect to Google’s web search and find additional information about geolocations on maps. Registered users of Google services can create custom maps using software tools – online mapping, i.e. create their own content in the form of customized maps with geospatial data and data layers. In this way, information can be added to user-created maps and displayed to users through the simultaneous use of several data layers for a better visual presentation of the situation in space. Google Maps also enables the embedding of created maps with data layers on third-party websites via the Google Maps API software. Another important function is the possibility of embedding the prepared map with the help of HTML code and displaying it on other websites and for the needs of more in-depth analyses with dedicated GIS tools. The created data layers can also be exported to a KML/KMZ file and used with (professional) GIS software.
With the help of personalised services from Google Maps, a dedicated map “Library network and gravity areas of Ljubljana City Library” was created, consisting of five basic data layers:
- a network of branch libraries in library districts, including a network of Mobile Library stops,
- gravity areas of branch libraries in Ljubljana,
- Ljubljana’s district authorities’ boundaries,
- A network of planned libraries in the Munipicial Spatial Plan and initiatives for new branch libraries,
- planned new buildings and urban development projects (private and public) in the City of Ljubljana.
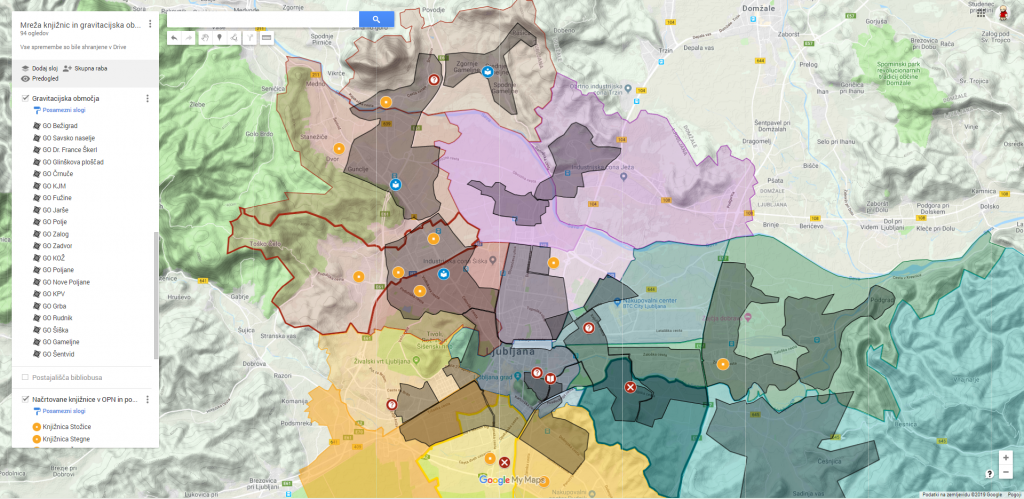
The network of existing branch libraries and the mobile library data layer in conjunction with Ljubljana’s district authorities’ boundaries data layer, enables a quick overview of the positioning of locations within the city. The overview is functionally upgraded by determining and mapping the gravity areas of branch libraries, and thus allows finding grey areas of the library network where library activities are not yet carried out in accordance with existing professional recommendations and regulations. The gravity areas are determined according to the demographic and statistical data prepared by the professional librarian analyst and based on the obtained demographic data from the STAGE tool. An important segment is data on planned libraries included in the Municipal Spatial Plan and detected initiatives for new branch libraries from different stakeholders, so we can easily check the compatibility of the proposed library sites with the existing library network.
A very important element of the tool is data on existing and planned urban projects and new buildings in the City of Ljubljana area, which is available at the level of individual micro-locations or areas of the Detailed Municipal Spatial Plan. These, too, are expected to have a significant impact on the future needs of the library network. Plans require a timely response from the library, regardless of whether it is the upgrading of social infrastructure (e.g. the construction of a new kindergarten or the area of organizing central activities) or the construction of residential buildings and the consequent increase in the number of potential users in individual areas. This type of information is also cross-compared with data from the City of Ljubljana Municipal Spatial Plan, where the URBinfo Portal is of great help.
Each individual element of the map can be upgraded with more detailed data and even multimedia elements, there is the possibility of the collaboration of additional editors and content uploaders, and embedding and publishing of the map on other websites and networks with the help of HTML code is also possible. The key element is the simplicity of the visual presentation because in this way we can more easily present our vision of the sustainable library network to funders, political decision-makers and strategic partners.
Segmentation of key data
It is also necessary to add a data aspect to the visualization. Surveys of the external environment have to be carried out and, by segmenting users, the library gets the basis for planning the development of the network and renovation of libraries, the creation of a library collection and the introduction of new services for users in the physical and virtual environment. A comprehensive review of the environment and a detailed comparison of the internal data collected by the library on its operation with data from the external environment means a greater possibility of appropriate placement in local environments.
As part of the research of the external environment, which is important for identifying the characteristics that the library must pay attention to when planning the library network and activities in it, the library must cover seven different areas with characteristic data:
- Geographical: area, number and density of inhabitants by municipalities or district communities.
- Demographics: age and share of age groups, share by gender, ethnic groups by municipalities or neighbourhood communities.
- Economic: social status of the population, number of unemployed, migration and daily migration by municipalities and the structure of economic activities by municipalities and district communities.
- Socio-cultural: educational, cultural, sports, social organizations and cultural heritage in municipalities and district communities.
- Technological: percentage of households with access to broadband Internet connections, wireless Internet, cable TV, etc.
- Natural: natural attractions and natural heritage in the municipality.
- Political and legal environment: regulation at the national level and conditions in the local environment.
Segmentation needs to include all residents living in the area where the library operates. Users can be segmented on three different bases:
- Demographic grounds (age, gender).
- Behavioural bases (habits of users, lifestyle, target groups, activities of user groups, interests and opinions of users, education). The library obtains data by regularly surveying user habits.
- Based on the use of library services (membership, visits).
The final stage is summarizing the data evaluation according to four aspects:
- Activities that the library does well and those that could be improved.
- Characteristics of the community that the library supports and those that could be further addressed.
- Factors in the external environment that support or inhibit the library from fulfilling its mission.
- Changes in the environment that the library wants to take advantage of and detection of unwanted changes in the environment (and what the library can do about it).
Plans for the future
On the basis of a comprehensive survey of the environment and spatial analysis, next year Ljubljana City Library will create a document Planning the library network, which will serve as a basis for the strategic planning of the library and as an aid to the city administration in situating new locations for branch libraries in the City of Ljubljana Municipal Spatial Plan. An effective Ljubljana City Library network will take into account the placement of library locations both in distinctly urban environments and in predominantly rural suburban environments and will also allow the closure of certain branch libraries, especially from the point of view of a unified network after the merger of independent libraries before 2008, and the introduction of a more branched network of mobile library stops, locations of individual library locations and possible new forms of library spaces (e.g. self-service libraries).
For the most accurate network analysis possible, in 2020 (Zakrajšek & Vodeb, 2020) Agent-based geographical modeling was proposed. Agent-based geographical modeling is a method for simulating complex urban environments using heuristic and approximated algorithms. The agent model for public libraries developed for the study demonstrates the possibilities for analyzing accessibility, exploring demographic data of potential users, finding underserved areas, and searching for the best locations or relocation sites for libraries. This model has been implemented and tested using the entire public library network of Slovenia. The practical implementation of the model in the Spatial Analysis of the Public Library Network in Slovenia Web Tool could greatly facilitate searching for the best locations or relocations for the Ljubljana City Library network in urban areas.
The use of spatial heatmaps and eco-maps[2] are also planned for the needs of the Ljubljana City Library network analysis.
This blog post is based on a paper by Resman, Špoljar & Klemen (2019).
Aleš Klemen is involved in development projects of the Ljubljana City Library, Slovenia, especially in the field of digitization, e-content and e-services, active citizenship and new information and communication technologies.
[1] The software tool ArcGIS, one of the most famous and widely used, even in the library environment, can cost up to several thousand euros.
[2] An eco-map, derived from Bronfenbrenner’s ecological system theory, is a type of diagram that shows the relationships between the individual entities that we show. Such a display serves to review the influences between stakeholders in the narrower or wider environment. In the case of libraries, the eco-map can be used for an overview of the importance, intensity and content of relations with the organizations with which they cooperate in their environment. For the library use in Slovenian public libraries see also Špoljar (2014) and Resman, Špoljar & Klemen (2019), both in Slovenian.
Useful resources
- Adkins, D. C. & Sturges, D. K. (2004). Library Service Planning with GIS and census data. Public libraries, 43(3), 165–170.
- Adkins, D. C., Haggerty K. C. & Haggerty, T. M. (2014). The influence of community demographics on new public library facilities. Proceedings of the American Society for Information Science and Technology Annual Meeting, 51(1), 1-8. https://doi.org/10.1002/meet.2014.14505101050
- Allen, J. (2019). Mapping differences in access to public libraries by travel mode and time of day. Library & Information Science Research, 41(1). https://doi.org/10.1016/j.lisr.2019.02.001
- Bishop, W. B. & Mandel, L. H. (2010). Utilizing geographic information systems (GIS) in library research. Library hi tech, 28(4), 536–547. https://doi.org/10.1108/07378831011096213
- Cheng, W., Wu, J., Moen, W.E., & Hong, L. (2021). Assessing the spatial accessibility and spatial equity of public libraries’ physical locations. Library & Information Science Research, 101089. https://doi.org/10.1016/j.lisr.2021.101089
- Donnelly, F. P. (2013). The geographic distribution of United States public libraries: an analysis of locations and service areas. Journal of librarianship and information science, 46(2), 110–129. https://doi.org/10.1177/0961000612470276
- Donnelly, F. P. (2015). Regional variations in average distance to public libraries in the United States. Library & Information Science Research, 37(4), 280–289. https://doi.org/10.1016/j.lisr.2015.11.008
- Edwards, J. B., Robinson, M. S. & Unger, K. R. (2013). Transforming libraries, building communities: the community-centered library. Lanham: Scarecrow Press.
- Guo, Y., Chan, C. H. & Yip, P. S. F. (2017). Spatial variation in accessibility of libraries in Hong Kong. Library & Information Science Research, 39(4), 319–329. https://doi.org/10.1016/j.lisr.2017.11.007
- Hertel, K & Sprague, N. (2007). GIS and census data: tools for library planning. Library hi tech, 25(2), 246–259. https://doi.org/10.1108/07378830710755009
- Higgs, G., Langford, M. & Fry, R. (2013). Investigating variations in the provision of digital services in public libraries using network-based GIS models. Library & Information Science Research, 35(1), 24–32. https://doi.org/10.1016/j.lisr.2012.09.002
- Koontz, C. M. (1997). Library facility siting and location handbook. Westport: Greenwood Press.
- Koontz, C. M. & Jue, D. K. (2001). The location of your library building: why it is important, and how to do it, using GIS (geographic information system software). In M.-F. Bisbrouck (ed.), Library Buildings in a Changing Environment (pp. 141–153). München: Saur.
- Koontz, C. M., Jue, D. K. & Bishop, B. W. (2008). Why public libraries close. Tallahassee: Florida State University. Retrieved from https://cdm15003.contentdm.oclc.org/digital/collection/p15003coll51/id/106
- Mandel, L. H. (2010). Geographic information systems: tools for displaying in-library use data. Information technology and libraries, 29(1), 47–52. https://doi.org/10.6017/ital.v29i1.3158
- Morris, A. & Brown, A. (2004). Siting of public libraries in retail centres: benefit and effects. Library management, 25(3), 127–137. https://doi.org/10.1108/01435120410522343
- Lim, H. – K. & Park, S. J. (2015). Designing a GIS-based planning support system for a public library building project. Journal of librarianship and information science, 47(3), 254–264. https://doi.org/10.1177/0961000614532673
- Park, S. J. (2012). Measuring public library accessibility: A case study using GIS. Library & Information Science Research, 34(1), 13–21. https://doi.org/10.1016/j.lisr.2011.07.007
- Park, S. J. (2012). Measuring travel time and distance in library use. Library hi tech, 30(1), 151–169. https://doi.org/10.1108/07378831211213274
- Resman, S., Špoljar, M. & Klemen, A. (2019). Izzivi pri načrtovanju knjižnične mreže splošnih knjižnic v mestnem okolju. Knjižnica, 63(1–2), 41–77. Retrieved from https://knjiznica.zbds-zveza.si/knjiznica/article/view/7645 (in Slovenian)
- Shorabeh, S.N., Varnaseri, A., Firozjaei, M.K., Nickravesh, F., & Samany, N.N. (2020). Spatial modeling of areas suitable for public libraries construction by integration of GIS and multi-attribute decision making: Case study Tehran, Iran. Library & Information Science Research, 42, 101017. https://doi.org/10.1016/j.lisr.2020.101017
- Siting public facilities, a guide for the City of Minneapolis. (2011). Minneapolis: Department of Community Planning and Economic Development. Retrieved from https://lims.minneapolismn.gov/Download/PriorFileDocument/-62714/WCMSP-171922.PDF
- Špoljar, M. (2014). Eko-karta knjižnice: shematski pregled sodelovanja knjižnice s partnerji v lokalnem okolju. Knjižničarske novice, 24(5), 2–3. https://knjiznicarske-novice.si/datoteka/KN_2014_5.pdf/KN_2014_5_1585160962393.pdf (in Slovenian)
- Študija prostorske simulacije mreže splošnih knjižnic. (2015). Ljubljana: Urbanistični inštitut Republike Slovenije. Retrieved from https://cezar.nuk.uni-lj.si/common/files/studije/studija_prostorske_simulacije_mreze_splosnih_knjiznic.pdf (in Slovenian)
- Vodeb, V. (2013). Zasnova prostorske analize dostopnosti dejavnosti splošnih knjižnic za prebivalstvo. Ljubljana: Urbanistični inštitut Republike Slovenije. Retrieved from https://cezar.nuk.uni-lj.si/common/files/studije/Analiza_Dostopnosti_Knjiznic_2013.pdf (in Slovenian)
- Vodeb, V. & Vodeb, G. (2015). Spatial analysis of the public library network in Slovenia. Journal of library administration, 55(3), 202–220. https://doi.org/10.1080/01930826.2015.1034047
- Zakrajšek, F.J. in Vodeb, V. (2020). Agent-based geographical modeling of public library locations. Library & Information Science Research, 42(2), 101013. https://doi.org/10.1016/j.lisr.2020.101013